Solving Complex Network Performance Problems Using Queuing Theory

- 1. Understanding the Problem Statement
- 2. Identifying the Queuing Model and Parameters
- 3. Using Excel for Computation and Visualization
- 4. Handling Open Queueing Networks
- 5. Optimization Strategies
- 6. Verifying the Results
- Conclusion
Solving complex network problems requires a deep understanding of queuing models, performance metrics, and computational tools. If you are looking for computer network assignment help, understanding the core concepts of queuing theory, network optimization, and response time calculations is crucial. Assignments in this field often involve analyzing M/M/1 and M/M/2 queues, modeling traffic flow, and assessing system bottlenecks. By leveraging queuing theory equations, utilizing Excel for calculations, and applying open queueing network analysis, students can efficiently determine system performance under varying conditions. Moreover, getting help with network performance assignment tasks can aid in mastering concepts such as system utilization, expected response times, and optimization strategies. Whether it’s assessing the number of users a LAN can support or evaluating website request routing efficiency, following a structured approach ensures accurate results and optimal network configurations. Understanding key parameters like arrival rates, service times, and network congestion helps in identifying bottlenecks and recommending improvements, such as enhanced caching strategies, increased bandwidth, or better load balancing mechanisms. By using tools like openqn.xls and Excel scatter plots, students can visualize trends and improve decision-making when tackling network performance assignments. Mastering these techniques not only helps in acing assignments but also prepares students for real-world challenges in network engineering and system optimization.
1. Understanding the Problem Statement

Before solving any network assignment, it is essential to carefully analyze the problem statement to identify key components like network structure, traffic flow, queuing requirements, and performance goals. Examining elements such as arrival rates, service distributions, and response time constraints provides a clear roadmap for approaching the solution. The first step in solving any network-related assignment is to carefully dissect the problem statement. Key elements to look for include:
- Network Configuration: Identifying the type of network (e.g., corporate LAN, cloud-hosted servers, etc.).
- Traffic Characteristics: Examining arrival rates (Poisson process), service rates, and packet sizes.
- Queuing Model: Determining whether the problem involves an M/M/1, M/M/2, or a more complex queueing system.
- Performance Metrics: Identifying the required outputs, such as response time, queue size, and system utilization.
For example, a problem involving a LAN connected to the internet via an access router with a limited bandwidth may require us to determine the number of users that can be supported while keeping response time under a threshold.
2. Identifying the Queuing Model and Parameters
Understanding whether the problem involves M/M/1, M/M/2, or more complex queuing models is crucial. This step includes identifying factors such as service rates, arrival rates, utilization, and expected response times, which form the foundation of performance analysis and optimization. Network queuing problems often involve the M/M/1 or M/M/2 models:
- M/M/1 Queue: A single server handling packets with exponentially distributed service times.
- M/M/2 Queue: A dual-server system where requests are handled by the first available server.
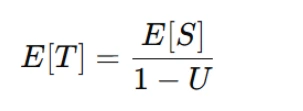
For an M/M/1 queue, we use the formula:
where:
- E[T] is the expected response time.
- E[S] is the expected service time.
- U=λ/μ is the utilization factor, where λ is the arrival rate and μ is the service rate.
If the problem involves multiple CPUs or servers, the M/M/2 model is used, incorporating additional factors for load distribution.
3. Using Excel for Computation and Visualization
Excel is a powerful tool for network analysis, helping to compute response times, visualize traffic patterns, and generate performance graphs. By structuring data in tabular format and using scatter plots, students can gain insights into network behavior and determine performance thresholds effectively. Many assignments require plotting response times against varying user loads to determine optimal performance levels. Here’s how to proceed:
- Set Up an Excel Spreadsheet:
- Column A: Number of users (e.g., 1 to 45).
- Column B: Compute λ for each user count as λ=5×textusers.
- Column C: Compute E[T] using the equation provided.
- Generate a Graph:
- Highlight the data and insert a scatter plot with smooth lines.
- Label axes appropriately (e.g., "Number of Users" vs. "Response Time").
- Analyze the Results:
- Identify the maximum number of users that keep response time within the acceptable limit.
4. Handling Open Queueing Networks
For problems involving multi-stage processing, such as web servers handling multiple requests, understanding open queueing networks is essential. Identifying visit ratios, computing service demands, and utilizing software like openqn.xls can help in analyzing bottlenecks and optimizing system efficiency. For problems involving multiple queues, such as a website with multiple processing stages, follow these steps:
- Identify Each Queue: Assign numbers to each queue (e.g., Firewall, Web Server, Database Server, etc.).
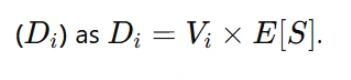
- Determine Visit Ratios (Vi) using routing probabilities.
- Compute Service Demands (Di) as
- Utilize Spreadsheet Tools (e.g., openqn.xls) to solve the queueing network equations and analyze the system’s bottlenecks.
For example, a request entering a multi-stage web processing system may pass through:
- Firewall/Cache: Quick verification of whether the response is already cached.
- Web Server: Dual-CPU system handling page requests.
- Database Server: Handling 80% of requests requiring database access.
- Router: Sending responses back to users.
By calculating response times and queue sizes at each stage, we can identify system limitations and recommend optimizations.
5. Optimization Strategies
Optimizing network performance involves enhancing bandwidth, implementing load balancing, improving caching mechanisms, and reducing service times. By analyzing response times and bottlenecks, targeted improvements can be made to increase efficiency. Strategies such as prioritizing critical traffic, reducing congestion, and optimizing queuing models ensure seamless network functionality while maintaining performance standards. Once the initial analysis is complete, the next step is to propose optimizations:
- Increase Bandwidth or CPU Power: If the bottleneck is the router or a server’s processing capacity.
- Improve Caching Efficiency: Reducing the percentage of requests requiring database access can significantly cut response times.
- Load Balancing: Distributing traffic across multiple servers (e.g., adding an additional Web Server CPU) can alleviate congestion.
- Prioritization Strategies: Implementing Quality of Service (QoS) policies to prioritize critical network traffic.
For instance, if reducing the database server’s processing time from 1.5ms to 1.0ms improves overall website response time, it suggests that optimizing server efficiency should be prioritized.
6. Verifying the Results
Once optimization strategies are applied, results must be verified through simulations and performance analysis. Cross-checking calculations, ensuring correct formula applications, and validating outputs with logical reasoning are essential steps. Utilizing charts, tables, and real-time performance monitoring tools helps assess whether the applied optimizations have successfully improved network efficiency. Before finalizing the assignment:
- Cross-check all calculations.
- Ensure all formulas are correctly applied.
- Validate findings with logical reasoning (e.g., does adding more users increase queue length?).
- Include visual representations such as charts and tables to support conclusions.
Conclusion
Solving network performance assignments requires a systematic approach: understanding the problem, applying the correct queuing models, performing calculations, and using visualization tools to interpret results. By following this structured method, students can efficiently tackle assignments involving network queuing theory and optimize system performance based on calculated insights. For additional help with solving complex computer network assignments, consider seeking expert guidance to ensure accuracy and efficiency in your solutions.